Microfluidics application note
Published on 27 August 2019
Precise and effective control of droplet generation is critical for applications of droplet microfluidics ranging from materials synthesis to lab-on-a-chip systems.
This application note focuses on microfluidic flow focusing droplet generation, where additional energy input promotes instabilities at the liquid-liquid interface and triggers droplet generation
Variation of droplet generation frequency and size with input pressures
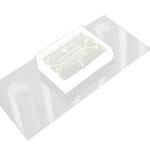
This chip has a classic flow-focusing geometry (Fig. 1). As described in the review on microfluidic droplets, flow-focusing is one of the three existing methods for droplet generation. The work was done with blue-colored water for the dispersed phase, and oil for the continuous phase. The diagram below (Fig.2) shows the set-up realized with the Elveflow instruments:

Figure 1: Geometry of the chip used for the creation of drops in flow-focusing

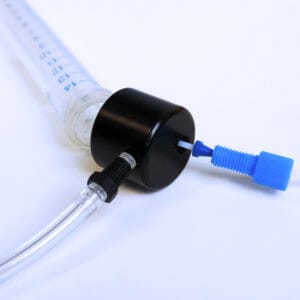
Figure 2: Set-up used for droplets generation in flow-focusing

[droplet_pack_rebound]
For further insight into droplet-based microfluidics, please refer to our droplet microfluidics userguide!
Droplets analysis was done using ADM (Automated Droplet Measurement) [1], a software developed by Dr Say Hwa Tan’s group from Griffith University, allowing an automated analysis of the droplets and to gather accurate data.
The first steps consist in (Fig.3):
- Importing the video
- Giving the pixel-micrometer scale correspondence (previously determined on ImageJ)
- Giving the number of frames per second (fps) (chosen when the video was acquired).
Once these steps completed, the software “handle everything”. First, the “Find background” button is used to automatically detect the background and remove it, in order to obtain an image without background (Figure 4).
Then, the “Find threshold” button allows to convert the image in binary, before applying a threshold allowing to detect all the present particles, in this case the droplets (Fig.5)
The last step is to start the analysis. The software will analyze the video frame by frame, tracking the droplets (Fig.6).
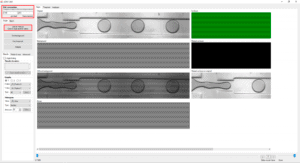
Figure 3: ADM Software interface – Selection of the video, the scale and the fps

Figure 4: ADM Software interface – Background detection and removal

Figure 5: ADM Software interface – Droplets detection

Figure 6: ADM Software interface – Droplets analysis
Once completed, all data is saved in different files in .csv format, and graphics can be directly exported from the software in image format (.jpg). In this case, data processing was done manually in Excel so that all data could be accessed, sorted and used appropriately in order to obtain adequate graphics.
The following tables present the different results obtained for the four rates previously presented. They present the most relevant factors to be considered when creating drops, namely the diameter, the polydispersity, and the position of rupture of the dispersed phase into droplets. The polydispersity measures the variation of droplets in size, and is calculated by dividing the standard deviation of the diameter distribution by the mean diameter of the droplets. Tables 1 to 4 show the results obtained after droplets analysis and data processing.

Table 1: Results of the droplets analysis formed in flow focusing with pc=200mbar pd=60mbar

Table 2: Results of the droplets analysis formed in flow focusing with pc=200mbar pd=70mbar

Table 3: Results of the droplets analysis formed in flow focusing with pc=200mbar pd=80mbar

Table 4: Results of the droplets analysis formed in flow focusing with pc=200mbar pd=99mbar
The results obtained in Table 5 are debatable because this analysis could only be carried out on 7 droplets. The results obtained for this experiment are therefore not very reliable. We must therefore be careful with the analysis of these results.
Several conclusions can be drawn from these results.
The polydispersity values, are all comprised between 0.19% and 1.74%, are indicative of the stability and quality of the pressure control obtained with the Elveflow’s instruments. Concerning the break positions of the droplets, they are very stable for each manipulation, with a variation only around 1.5%. In addition, the break position moves as the intersection between the two channels progresses to the exit of the constriction (from experiment a) to d). This phenomenon is quite normal and shows the transition between the “dripping” regime obtained during manipulation a) and the “squeezing” regime of manipulation d).
Finally, this experiment shows that for a given pressure applied on the continuous phase, the increase of pd leads to an increase in the droplets diameter and in the frequency of creation.
References
- ZhuangZhi Chong et al., Automated Droplet Measurement (ADM) : an enhanced video processing software for rapid droplets measurements, Microfluidics and Nanofluidics, (2016) http://a-d-m.weebly.com

Microfluidics knowledge
Do you want tips on how to best set up your microfluidic experiment? Do you need inspiration or a different angle to take on your specific problem? Well, we probably have an application note just for you, feel free to check them out!

 Job
Job Collaborations
 Customer
 Other
Other
