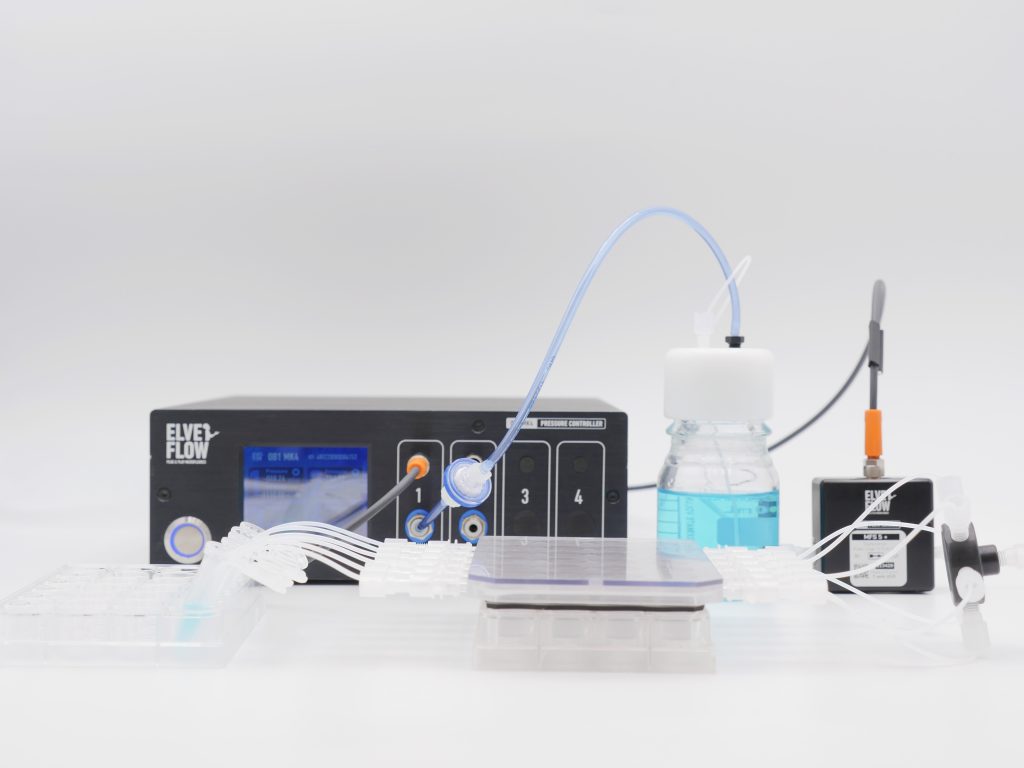
Endothelial Shear Stress in a Well Plate
Control wall shear stress for endothelial differentiation.A clamp-on lid, and nothing else to change.
Alignment and mature junctions, under flow.
Reproducible on every replicate.
5 to 15 dyn/cm² on an endothelial monolayer.
The cells remain in a standard 24 and 6-well plates, sealed by a lid that creates a shallow flow chamber above them, exposing each well to the selected wall shear stress throughout the run.
Features & Benefits
shear stress CONTROL in endothelial cell culture
The drag exerted by flowing medium is a mechanical cue that activates flow-sensitive pathways and aligns the cytoskeleton in endothelial cells. It also contributes to the organisation of cell junctions. Static well culture lacks this cue, so monolayers grown without flow are missing an important part of their physiological environment. Reproducing this mechanical stimulus requires more than simply moving the medium: the shear stress experienced by the cells also needs to be defined and reported. The approaches below differ in how well they allow this value to be controlled and quantified.
Orbital shaker. An orbital shaker keeps the culture in its plate while setting the medium in motion. As the plate moves in a small circle, the medium swirls in each well. The shaker has a low equipment cost, turning it into a favourite choice for plate-based protocols. However, shear stress is not uniform, approaching zero near the centre of a well and peaking near the wall. The shear stress depends on fill volume, well diameter, and rotation speed, meaning that cells in the same well may experience different levels of stimulation. Rotation speed is easy to report, but the exact shear stress experienced by each cell is harder to define.
Rocker or tilting platform. A tilting platform raises one edge of the plate, allowing medium to travel across each well before moving back on the next tilt. For long cultures, one practical advantage is that the platform needs neither pumps nor tubing. Within each stroke, though, the medium speeds up and slows down before reversing direction. The platform is set through its angle and period rather than through a target shear stress. The resulting stimulus changes direction from one stroke to the next, unlike the sustained directional flow associated with endothelial alignment.
Perfusion on a dedicated chip. In a microfluidic chip driven by a pressure controller or syringe pump, the culture sits in a channel with a known geometry. Measuring the flow makes it possible to derive wall shear stress from the flow rate and channel dimensions. This is an established approach in endothelial mechanobiology. This approach requires a change of culture format. Moving away from the plate format means reworking the entire workflow analysis pipeline already validated for it. For teams working with chips, our organ-on-a-chip pack covers this approach.
A perfusion lid on the plate. A perfusion lid offers another route: keep the culture in its standard plate and seal a shallow flow chamber above the monolayer. The lid’s geometry determines shear, built into its moulded path rather than assembled by hand. The Elveflow pressure controller acts from the gas side, delivering flow up to 20 times steadier than a syringe or peristaltic pump. The culture remains in the same plate, so existing methods still apply.
Setting and changing wall shear stress
In a flow chamber, the endothelial monolayer occupies a small fraction of the available volume, and once the culture is established, the height of the medium above the cells remains nearly constant. This makes chamber height, together with flow rate, one of the main parameters governing wall shear stress. At the same flow rate, reducing the chamber height increases the shear stress applied to the cells.
This relationship makes it possible to reproduce different physiological conditions within the same plate format. Arterial and venous endothelial cells, for example, are exposed to different levels of wall shear stress in vivo. Adjusting the chamber height therefore provides a way to explore these different conditions without changing the overall experimental setup.
Flow rate then controls how the stimulus evolves over time. A constant flow produces steady shear stress, while cycling the flow rate can reproduce pulsatile conditions. The rate can also be gradually increased or decreased when a ramped stimulus is required. In practice, chamber height sets the shear stress reached at a given flow rate, while the programmed flow profile determines how that stimulus changes over the course of the experiment.
Keeping the selected shear stress on target
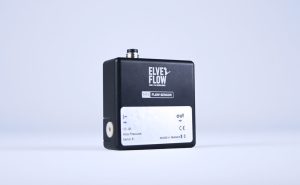
The shear stress selected at the start of a run must remain at the end. Holding that shear stress comes down to holding the flow rate delivered to the lid. A sensor upstream of the lid measures the actual flow, and the controller adjusts pressure to bring it back to the setpoint. This feedback maintains the flow supplied to the lid.
The fluidic circuit can change during an experiment. A 0.22 µm filter may clog in serum-containing medium. Tubing can warm, and the reservoir level can fall. The sensor measures the resulting flow, while the controller adjusts pressure to keep it at the setpoint. Keeping the flow rate on target also keeps the shear stress at the cells on target. Rising pressure may indicate clogging, even before its effects become visible in the culture.
Long-term perfusion without manual intervention
With flow maintained by feedback, a culture can continue without repeated manual intervention. Pressure drives medium from a connected container at the selected flow rate. A larger container extends the run without changing the setting. The software can then carry out the programmed flow and medium-exchange sequence overnight or over several days.
- Long runs, hands-off: set the flow rate and exchange sequence in advance.
- Timed exchanges: schedule flushing and perfusion through the same path; dosing can be scheduled too.
- Shaped flow: the pressure source can follow a programmed profile rather than a fixed setpoint. A rhythmic cycle can be reproduced directly. A gradual change can be programmed as a ramp, and user-defined profiles are also supported.
- Equipment synchronisation: a TTL trigger can synchronise a perfusion step with image acquisition.
SDKs for Python, MATLAB, LabVIEW, and C++ also allow the setup to be controlled from your own code.
A more consistent setup across replicates
An alignment experiment is a comparison: static against perfused, or one shear stress against another. It only holds if the wells meant to be identical really are. Separate assemblies can introduce variation from tubing length or connection differences. If one well receives less shear, the weaker alignment can be mistaken for a biological difference. A single moulded part carries the flow and maintains the same chamber height above each well, eliminating separate assembly for every replicate.
Shared geometry doesn’t guarantee identical shear stress at every point. Flow is faster near the inlet and outlet, where alignment can be more pronounced. Wells on the same path are connected in series, so any compound added upstream travels to the wells further along the path. This arrangement must be considered when wells need independent treatment. If the protocol treats the entire path with the same addition, the same arrangement can be used.
One shared flow path for the plate
One shared flow path simplifies the plate’s operation. A single pressure-driven line supplies the plate, and a sensor measures flow upstream. This provides one measurement for the shared flow path, not separate measurements for every replicate.
Adding replicates uses additional plate space, not individual pumps and flow lines for each well. A separate-line setup requires one pump per well, along with repeated assembly and validation. A flow sensor is installed upstream of the lid.
Endothelial differentiation under defined shear
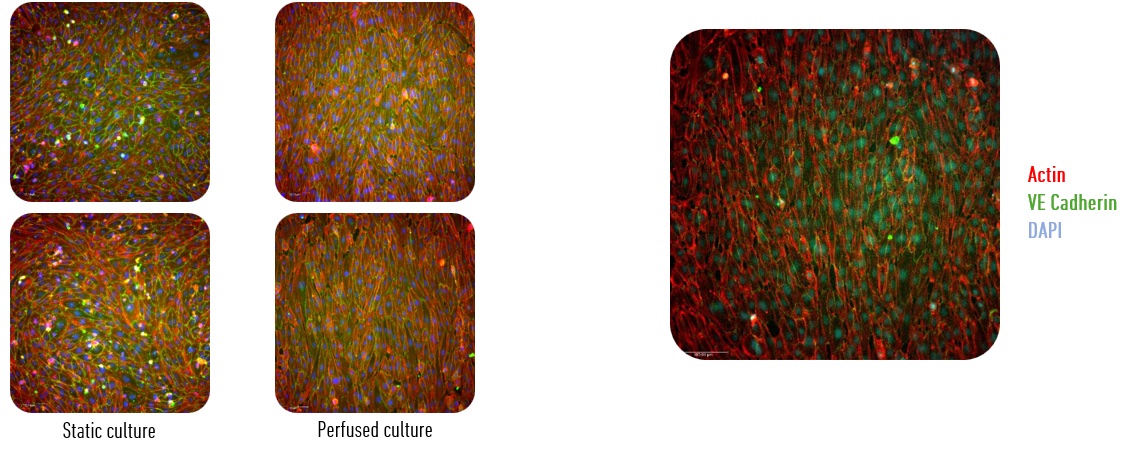
Endothelial differentiation under defined shear is marked by alignment with the direction of flow. Human coronary artery endothelial cells seeded in a standard well plate at 152,000 cells, 17 to 18 hours before perfusion began, demonstrate the contrast: cells in static wells have no common direction, while those perfused under the lid align with the flow. At 20× magnification, actin, VE-cadherin, and DAPI staining allow examination of cytoskeletal orientation and cell junctions.
For the Methods section, this readout can be paired with the applied shear stress using the flow rate and chamber height, rather than relying on motor speed alone.
Changing shear stress in the same plate format
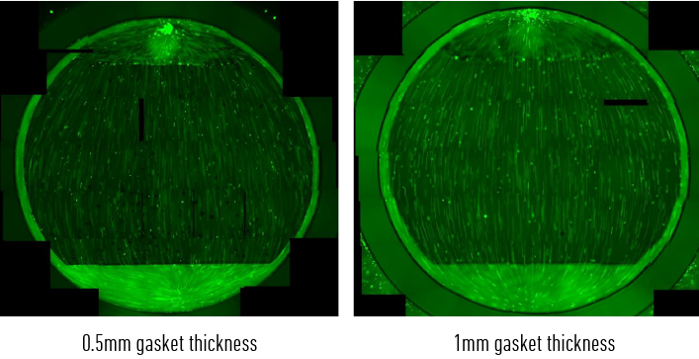
Arterial and venous beds experience different wall shear stresses, so comparing their phenotypes means testing more than one condition. The lid sets the chamber height; changing that height changes the shear stress without altering the plate format or flow rate. The effect can be seen by tracking fluorescent beads across the well: their speed changes with chamber height, while the plate, tubing, and imposed flow rate remain unchanged.
Imaging the culture while it runs
Imaging can take place while perfusion continues. The lid is clear, with polished surfaces and a viewing area above the wells, allowing the plate to stay on the microscope stage for the whole run. Time-lapse or live-cell imaging can then follow endothelial alignment without opening the fluidic circuit.
| Perfusion lid |
|---|
| Plate format: standard 24-well and 6-well plates. |
| Inter-well filters: 0.22 µm PTFE. |
| Seal: silicone gasket. |
| Sterilisation: gamma irradiation. |
| Clamping frame: manual. |
| Flow measurement |
| One flow sensor, upstream of the lid. |
| OB1 MK4 | |||||
|---|---|---|---|---|---|
| PNEUMATIC SPECIFICATION | |||||
| Channel pressure range | 0 to 200 mbar(1) (0 to 2.9 psi) |
0 to 2,000 mbar(1) (0 to 29 psi) |
0 to 8,000 mbar(1) (0 to 116 psi) |
-900 to 1,000 mbar(1) (-13 to 14.5 psi) |
-900 to 6,000 mbar(1) (-13 to 87 psi) |
| Pressure stability(2) | 0.015 % FS(1) 0 µbar (0.0004 psi) |
0.005 % FS(1) 100 µbar (0.0014 psi) |
0.006 % FS(1) 500 µbar (0.007 psi) |
-900 to 500 mbar | -900 to 2,000 mbar |
| 0.005 % FS(1) 100 µbar (0.0014 psi) |
0.005 % FS(1) 350 µbar (0.005 psi) |
||||
| 500 to 1,000 mbar | 2,000 to 6,000 mbar | ||||
| 0.007 % FS(1) 150 µbar (0.0021 psi) |
0.007 % FS(1) 525 µbar (0.0076 psi) |
||||
| Response time(3) | Down to 10 ms | ||||
| Setting time(4) | Down to 50 ms | ||||
| Minimum pressure increment | 0.006 % FS(1) 12 µbar (0.00017psi) |
0.006 % FS(1) 120 µbar (0.0017 psi) |
0.006 % FS(1) 480 µbar (0.007 psi) |
0.0064 % FS(1) 120 µbar (0.0017 psi) |
0.0064 % FS(1) 420 µbar (0.006 psi) |
| Pressure supply | 1.5 bar (or Max pressure + 0.5 bar) to 10 bar Non corrosive, non explosive, dry and oil-free gases, e.g. air, argon, N2, CO2, … |
||||
| Input vacuum(5) | / / |
Any value from -0.7 to -1 bar Compatible with vacuum pump or vacuum line |
|||
| Input pneumatic connector | 6 mm push-in | ||||
| Output pneumatic connector | 4 mm push-in | ||||
| Liquid compatibility | Non contact pump Any aqueous, oil, or biological sample solution. |
||||
| FLOW CONTROL | |||||
| Flow sensor compatibility | Compatible with the whole MFS and BFS range Monitoring and feedback loop flow control available | ||||
| Flow sensor compatibility | From 0,1 µL/min to 500 mL/min (indicative, please refer to the MFS and BFS series) | ||||
| Flow sensor compatibility | Non-contact pump Any aqueous, oil, or biological sample solution. | ||||
| CONTROL & MONITORING | |||||
| Software control | Elveflow Smart Interface – Windows 10, 11, both 32 and 64 bit versions supported | ||||
| Software Development Kit | Libraries available: Matlab, Python, LabView, C++ | ||||
| Flow sensor compatibility | Non-contact pump Any aqueous, oil, or biological sample solution. – Windows 10, 11, both 32 & 64 bit versions supported Serial/UART communication protocol on request | ||||
| Data management | Possibility to log and extract data (CSV), channel and sensor detailed information using ESI | ||||
| Input profiles | Possibility to load profiles: ramp, sine, triangle, square, or custom | ||||
| Automation | Generate step-by-step sequences using the ESI built-in sequence management Log and export custom configurations (CSV) | ||||
| Screen | LCD screen showing pressure and sensor flow rate in real time | ||||
| ELECTRICAL SPECIFICATIONS | |||||
| Voltage | 24V | ||||
| Typical power | 12W | ||||
| Power connection | DC power connector, Plug, 3A, 2.1mm, 12mm | ||||
| Interface | USB Type B | ||||
| Communication type | Serial | ||||
| Sensor connection | M8 4-pins, one connector per channel | ||||
| Compatibilit | Elveflow sensors: MFS, BFS, MPS, MFP, MBD Custom sensors: 5 to 24V supply voltage, 0 to 10V readout voltage | ||||
| Triggers | Input and Output TTL signal 0V or 5V | ||||
| Supply Voltage Range (V) | 100 to 240 VAC | ||||
| Supply AC Frequency (Hz) | 50 to 60 Hz | ||||
| Maximum Output Current (A) | 1.67 A | ||||
| Maximum Output Power (W) | 40 W | ||||
| MECHANICAL SPECIFICATIONS | |||||
| Dimensions (length x width x height) | 240 x 223 x 83 mm | ||||
| Weight | 1.4 kg to 2.9 kg | ||||
(1) Max pressure value might vary by +/- 2.5% (2) Pressure stability (standard deviation) measured over the full pressure range with an external high accuracy pressure sensor (Druck DPI150) (3) Time required to reach 5% of the setting point. Depending on your computer’s operating system (4) Time required to reach 95% of the set point. Volume dependent – Measurement was done on 12 mL reservoir for a set point from 0 to 200 mbar (5) A vacuum source is mandatory for calibration and use of dual channels even if the channels are to be used in pressure only.

Frequently Asked Questions
Your cells do not need to move to another culture format. The standard version is for 24-well plates, and a 6-well Transwell version is also available. The cells stay in the same plate from seeding through perfusion. The liquid handler, plate reader, imaging settings, and analysis pipeline already validated for that format can therefore still be used. With the Elveflow OB1 pressure controller and a flow sensor, the sealed space above the cells becomes the chamber in which wall shear stress is set.
For endothelial monolayers, a standard working range is around 5 to 15 dyn/cm², which can be reached with the pack. Within this range, endothelial cells align with the flow and organise their junctions. The shear stress is set by the flow rate delivered to the lid together with the chamber height above the cells.
The pack includes the perfusion lid and its seals, with the flow driven by the Elveflow OB1 pressure controller. A flow sensor is installed upstream of the lid. The reservoirs connect through supplied caps, adapters, and tubing, completing the liquid path. Elveflow Smart Interface runs the programmed sequence. You provide the plate and cells; the medium and experimental protocol remain yours.
Shear stress can be adjusted through chamber height or flow rate. Reducing the chamber height increases shear without increasing medium renewal, while the Elveflow OB1 maintains the selected flow rate using feedback from the flow sensor. Changing the flow profile then makes it possible to apply steady, pulsatile, or ramped shear. In fixed-geometry systems, shear and medium renewal remain coupled.
In the contact form, tell us which plate format and cell model you use, together with the wall shear stress you want to apply. We will use those details to match the lid configuration and seal thickness, then select the pressure controller and sensor for the setup. We can also go through any setup questions before purchase.



 Job
Job Collaborations
 Customer
 Other
Other